Perform a Data Normality Test in Excel using the QI Macros
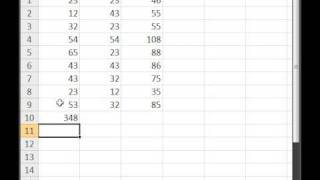
Statistical analysis may rely on your data being "normal" (i.e., bell-shaped), so how can you tell if it really is normal? The two tests most commonly used are: 1. Normal Probability Plot 2. p-value or Critical Value method The Descriptive Statistics or Normality Test in the QIMacros Anova Tools uses the Anderson-Darling method to analyze normality more rigorously. The output includes the Anderson-Darling statistic, A-squared, and both a p-value and critical values for A-squared. For more information, see: http://www.qimacros.com/hypothesis-testing/data-normality-test/ Download the 30-day trial at: http://www.qimacros.com/trial/30-day The QI Macros Control Chart Software for Excel creates control charts, histograms, paretos, box whisker plots and more. You can also perform Anova, t test, f test, regression, etc. This video shows you how to perform a data normality test in Excel using the QI Macros.

 HD
HD
 HD
HD HD
HD HD
HD HD
HD
 HD
HD
 HD
HD HD
HD HD
HD HD
HD HD
HD HD
HD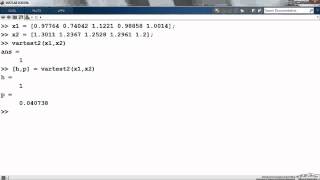 HD
HD HD
HD HD
HD HD
HD HD
HD HD
HD
 HD
HD HD
HD HD
HD HD
HD HD
HD HD
HD HD
HD