Keltner channel forex robot trading based on variety of Keltner channel indicators. HD
https://forexfactory1.com/p/To0P/ https://signal2forex.com/product/autotrading_forex_robot_keltner_channel/ System: Metatrader 4 Needed indicators: in zip archive Timeframe: M15 Currency pair: GBPUSD Limits by accounts: No Limits by time: No Type of trading: Middle-term trading Neural network: light Number of signals using in trading: 4 Moneymanagement: yes Using with other EAs: yes Broker account: any account Max. spreads allowed: 4 (40) TakeProfit and StopLoss max used: 153(SL), 478(TP) Duration of trades: average 8 hours – 4 days Lots: 0,01 – 100 VPS or Laptop: need 24/5 online Using indicators: - Keltner channel indicator. Keltner channel indicator - are volatility-based envelopes set above and below an exponential moving average. This indicator is similar to Bollinger Bands, which use the standard deviation to set the bands. Instead of using the standard deviation, Keltner Channels use the Average True Range (ATR) to set channel distance. The channels are typically set two Average True Range values above and below the 20-day EMA. The exponential moving average dictates direction and the Average True Range sets channel width. Keltner Channels are a trend following indicator used to identify reversals with channel breakouts and channel direction. Channels can also be used to identify overbought and oversold levels when the trend is flat. Indicators based on channels, bands and envelopes are designed to encompass most price action. Therefore, moves above or below the channel lines warrant attention because they are relatively rare. Trends often start with strong moves in one direction or another. A surge above the upper channel line shows extraordinary strength, while a plunge below the lower channel line shows extraordinary weakness. Such strong moves can signal the end of one trend and the beginning of another. With an exponential moving average as its foundation, Keltner Channels are a trend following indicator. As with moving averages and trend following indicators, Keltner Channels lag price action. The direction of the moving average dictates the direction of the channel. In general, a downtrend is present when the channel moves lower, while an uptrend exists when the channel moves higher. The trend is flat when the channel moves sideways. A channel upturn and break above the upper trendline can signal the start of an uptrend. A channel downturn and break below the lower trendline can signal the start a downtrend. Sometimes a strong trend does not take hold after a channel breakout and prices oscillate between the channel lines. Such trading ranges are marked by a relatively flat moving average. The channel boundaries can then be used to identify overbought and oversold levels for trading purposes.
 HD
HD![[Hindi]How to study technical charts and do Technical trend analysis of stocks in India?](https://i.ytimg.com/vi/N0f_OfbHqpU/mqdefault.jpg) HD
HD HD
HD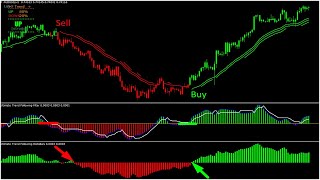 HD
HD HD
HD HD
HD HD
HD
 HD
HD HD
HD HD
HD HD
HD HD
HD
 HD
HD HD
HD HD
HD HD
HD HD
HD HD
HD HD
HD HD
HD HD
HD HD
HD HD
HD HD
HD HD
HD HD
HD HD
HD HD
HD HD
HD