videose
Главная
Displaying
thumbs
Arduino plot graph using Python
HD
youtube.com
09.01.2019
In this video, I have demonstrated how to interface Arduino with Python and how to read the analog signal from Arduino and plot it.originally published at : ...
Похожие
видео
HD
29.03.2020
20:56
Dropdown Selector- Python Dash Plotly
youtube.com
HD
10.02.2022
18:35
Interactive Python Dashboard with Plotly Dash TigerGraph
youtube.com
HD
27.09.2022
22:23
Use a Slider in a Python Data App - Dash Plotly
youtube.com
HD
05.10.2020
23:18
All about the Graph Component - Python Dash Plotly
youtube.com
HD
09.01.2023
17:41
Create a Python Dashboard from Multiple Excel Sheets - Plotly Dash
youtube.com
29.11.2023
48:19
Python Django Tutorial: Full Featured Inventory Management System | Part 7: Dashboard...
rutube.ru
29.11.2023
34:43
Plotly Level-1 Visualization Tutorial (with line by line code) - V_3
rutube.ru
26.11.2023
30:06
Build a Complete Social Media Analysis Dashboard with Dash Plotly in Python - Part 2
rutube.ru
02.12.2023
47:46
Seaborn Visualization Tutorial (with line by line code) - V_2
rutube.ru
14.10.2021
50:25
Generate Beautiful & Interactive Plots Using Plotly: Python for Mechanical Engineers
youtube.com
02.12.2023
01:05:33
Python Plotly Course: Learn Data Visualization in Python
rutube.ru
29.11.2023
32:49
Bar Graph -- Python Plotly
rutube.ru
HD
09.01.2019
04:25
Arduino plot graph using Python
youtube.com
24.05.2013
00:33
Arduino real-time plot using Python Matplotlib
youtube.com
HD
01.06.2020
04:43
Real Time Plotting with arduino and python (matplotlib )
youtube.com
HD
04.02.2018
00:37
Plotting in Real Time with Arduino and Python
youtube.com
04.02.2018
00:37
Arduino Real Time Multiple Plot with Python (Single Graph)
youtube.com
HD
28.10.2017
03:42
Arduino Realtime graph plot using Matlab
youtube.com
HD
03.12.2023
04:43
Real Time Plotting with arduino and python (matplotlib )
rutube.ru
HD
18.04.2020
10:47
Python Tutorial - Plot Graph with real time values | Dynamic Plotting | Matplotlib
youtube.com
HD
20.06.2018
00:25
Plotting accelerometer data in real time with PyQtGraph
youtube.com
02.12.2023
01:34:48
How to Create Excel Data Management System in Python - Full Tutorial
rutube.ru
HD
14.02.2014
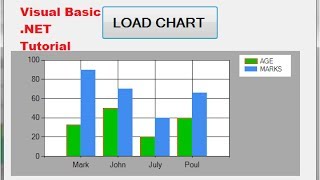
08:25
Visual Basic .NET Tutorial 36 - How to use Chart /Graph in VB.NET
youtube
HD
24.02.2017
16:00
Tesis & Econometría: Generación de filtros en el programa R o R Studio
youtube
HD
24.02.2017
22:38
Tesis & Econometría: Introducción al programa R o R Studio
youtube
HD
05.11.2017
09:48
Create Python GUI Application using PyQt5 Designer with Python 3.6.3
youtube
HD
14.04.2016
07:09
Raspberry Pi: Charting Temperature and Humidity Data
youtube
HD
19.08.2022
01:32:33
udemy-the-complete-pythonpostgresql-course-2.0-2022-1-1
vk.com
 HD
HD HD
HD HD
HD HD
HD HD
HD


 HD
HD
 HD
HD HD
HD
 HD
HD HD
HD HD
HD HD
HD
 HD
HD HD
HD HD
HD HD
HD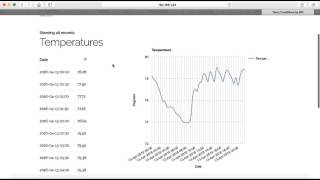 HD
HD HD
HD