videose
Главная
Displaying
thumbs
Scatter Chart & Bar Graph | Matplotlib.pyplot | scatter() | bar() | Part 3 | Class 12 | IP
HD
youtube.com
19.05.2020
In this video we are explaining about Data Visualization of Unit – 1 of Informatics Practices for class 12th.
Похожие
видео
HD
19.05.2020
01:24:54
Scatter Chart & Bar Graph | Matplotlib.pyplot | scatter() | bar() | Part 3 | Class 12 | IP
youtube.com
02.12.2023
01:24:53
Scatter Chart & Bar Graph | Matplotlib.pyplot | scatter() | bar() | Part 3 | Class 12 | IP
rutube.ru
HD
26.09.2020
28:40
Create Simple Graphs in R Studio | R Beginners Graphs Tutorial | Bar Plot | Scattered
youtube.com
HD
10.07.2013
05:37
3D Plotting in Matplotlib for Python: 3D Scatter Plot
youtube.com
HD
29.07.2023
12:27
Bar Plot - How to Plot a Bar Graph in Matplotlib Python
youtube.com
02.10.2021
02:30
How to draw Bar Plots in python | Bar charts | Python | Matplotlib
youtube.com
HD
11.06.2019
34:25
Matplotlib Tutorial (Part 2): Bar Charts and Analyzing Data from CSVs
youtube.com
HD
31.07.2020
22:16
matplotlib pyplot legend (Python) Sample Program with output Class 12 | Computer Science
youtube.com
HD
16.03.2023
01:16:30
Matplotlib Pyplot | One Shot Video | Score 70/70 Class 12 Informatics Practices
youtube.com
HD
09.05.2020
09:46
Matplotlib.pyplot || graphs & charts | data visualization using pyplot | class 12 IP
youtube.com
HD
20.02.2021
19:04
How to Create a Stacked Bar Chart with Python, Matplotlib, and Pyplot
youtube.com
01.07.2019
10:56
Python Basics Matplotlib Pyplot Bar Chart
youtube.com
HD
11.08.2019
01:04:19
Python Matplotlib Tutorial for Beginners - Part 2 | Visualization with Python, Matplotlib
youtube.com
HD
22.03.2021
04:10
bar chart and line graph in matplotlib python
youtube.com
24.07.2021
11:24
Matplotlib library 3d scatter plot part:12 | data science |exploratory data analysis
youtube.com
HD
03.04.2020
05:03
Matplotlib tutorial- Scatter graph
youtube.com
19.08.2021
11:35
Scatter Plot Matplotlib || Lesson 3.8 || Python for Data Science || Learning Monkey
rutube.ru
03.01.2021
23:11
Class 12 IP Chapter 3 - Part 1 |Plotting WITH Pyplot|DATA Visualization|Line & Scatter...
youtube.com
24.01.2020
09:23
Python plot and scatter graph part 1
youtube.com
26.12.2021
14:01
How to draw pie, bar, scatter charts , line, dotted line using matplotlib in Machine...
youtube.com
04.04.2020
26:19
Part 02 Data Visualization Using Pyplot Python Scatter and Bar chart
youtube.com
02.12.2023
26:19
Part 02 Data Visualization Using Pyplot Python Scatter and Bar chart
rutube.ru
HD
17.12.2022
09:10
Data Visualization using Matplotlib | Line plot, Scatter plot and Bar chart
youtube.com
09.09.2020
43:09
Python: NumPy-Arrays, matplotlib.pyplot-Line Chart, Bar Chart, Scatter Plot
youtube.com
HD
04.07.2020
32:52
Plotting WITH Pyplot 1 - Bar Graph and Scatter Plots
youtube.com
10.06.2021
11:37
#4 Graph plotting in python | Pyplot | Matplotlib | Line | Bar | Scatter | Pie
rutube.ru
02.12.2023
31:48
Plotting with pyplot -1 bar graph and scatter plot (PART-2)
rutube.ru
HD
24.08.2020
05:37
Matplotlib pyplot Tutorial Data Visualization Part -5 Scatter Chart using Plot function
youtube.com
02.12.2023
02:33
matplotlib.pyplot | How to plot scatter graph in python
rutube.ru
02.12.2023
05:13
Graphing with matplotlib.pyplot to make a scatter plot with error bars
rutube.ru
HD
31.08.2020
15:44
Multiple Bar Chart | Grouped Bar Graph | Matplotlib | Python Tutorials
youtube.com
06.02.2022
15:02
Data Visualization Using Pandas, Matplotlib, Pyplot #Pandas #Python #Matplotlib
youtube.com
Показать еще
 HD
HD
 HD
HD HD
HD HD
HD
 HD
HD HD
HD HD
HD HD
HD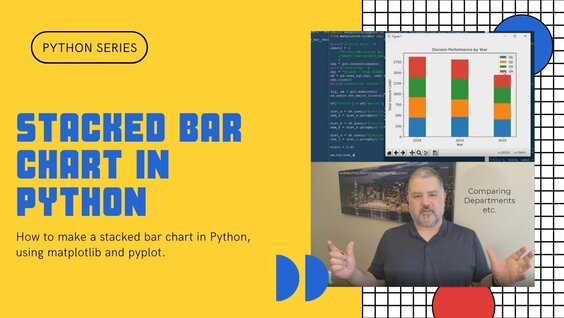 HD
HD
 HD
HD HD
HD
 HD
HD


 HD
HD
 HD
HD

 HD
HD

 HD
HD