videose
Главная
Displaying
thumbs
How to Create a Stack Plot in Matplotlib with Python
HD
rutube.ru
02.12.2023
Рассказывается как добавлять легенду для графиков и создавать ее оформление, используя метод legend(). Узнаете как рисовать геометрические фигуры непосредств...
Похожие
видео
HD
28.02.2020
35:06
Bar plot with data labels in R - Econometrics and Statistics with R
youtube.com
13.11.2020
19:14
How to make a GUI using PyQt5 and Matplotlib to plot real-time data: PyQt5 tutorial...
youtube.com
HD
04.10.2023
08:17
Matplotlib Line Plot - How to Plot a Line Chart in Python using Matplotlib - Complete...
youtube.com
HD
11.01.2018
04:23
Tiny Tutorial 5: Create Scatter Plots in Python with Matplotlib
youtube.com
HD
02.12.2023
07:12
Plot Time Series Data In Python With Matplotlib, Pandas and Numpy Using Jupyterlab
rutube.ru
18.08.2023
11:00
Line Plot - How to Create Line Plot in Matplotlib Python
youtube.com
HD
03.03.2022
20:02
Matplotlib Scatter Plot - How to Create a Scatterplot in Python Matplotlib?
youtube.com
HD
19.01.2024
14:05
Line Plot - How to Create Line Plot using Plotly in Python
youtube.com
HD
29.07.2023
12:27
Bar Plot - How to Plot a Bar Graph in Matplotlib Python
youtube.com
28.11.2017
02:33
Tiny Tutorial 4: Line Plots in Python with Matplotlib
youtube.com
HD
10.10.2020
04:30
How to plot a pie chart in matplotlib in Python programming language
youtube.com
HD
16.04.2020
05:37
How to Create Plots using Matplotlib in Python | Python for Finance Beginners 2021
youtube.com
12.06.2021
04:27
How to Plot a Line Chart in Python using Matplotlib | Creating linear plots in Python
youtube.com
02.12.2023
05:49
How To Install MatPlotLib On A Mac
rutube.ru
HD
29.11.2023
08:05
How to make a chart with 3 y-axes using matplotlib in python
rutube.ru
06.03.2022
32:01
Matplotlib Pie Chart / Plot - How to Create a Pie Chart in Python Matplotlib?
youtube.com
10.11.2016
03:12
Python Tutorial : Customizing plots with python matplotlib
youtube.com
15.01.2020
07:16
Matplotlib Tutorial | Example of how to create chart animation with matplotlib in...
youtube.com
HD
20.02.2021
19:04
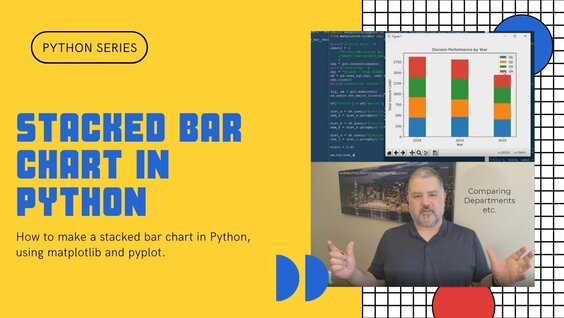
How to Create a Stacked Bar Chart with Python, Matplotlib, and Pyplot
youtube.com
HD
02.01.2021
11:35
Matplotlib Line Graph - How to Create a Line Graph in Python With Matplotlib
youtube.com
25.10.2019
09:25
Matplotlib: Your First Plot With Python
youtube.com
HD
21.12.2021
08:04
How to make a chart with 3 y-axes using matplotlib in python
youtube.com
HD
02.12.2023
10:42
How to Create a Stack Plot in Matplotlib with Python
rutube.ru
HD
18.05.2020
06:09
Python Plotting with Matplotlib - Graphing a Cumulative Distribution Function
youtube.com
HD
19.08.2023
02:46
Python GUI Tutorial: Create a Function Plotter with Tkinter and Matplotlib
youtube.com
HD
19.05.2020
03:56
Python Plotting with Matplotlib - Scatter Plot
youtube.com
HD
19.05.2020
07:28
Python Plotting with Matplotlib - Combo Graph
youtube.com
HD
18.05.2020
06:52
Python Plotting with Matplotlib - Graphing Functions
youtube.com
HD
20.04.2018
10:37
Python Data Visualization | How to Create Scatter Plot in Python using Matplotlib library
youtube.com
02.12.2023
05:13
Graphing with matplotlib.pyplot to make a scatter plot with error bars
rutube.ru
HD
04.02.2024
01:12:15
Part 3 - How to Create a Plotly Dash App with Python & Tailwind CSS - Full Tutorial
youtube.com
02.12.2023
45:35
Finance Tips | Simple Portfolio Tracker With Dash, Plotly and Bootstrap - Python Tutorial
rutube.ru
Показать еще
 HD
HD
 HD
HD HD
HD HD
HD
 HD
HD HD
HD HD
HD
 HD
HD HD
HD

 HD
HD


 HD
HD HD
HD
 HD
HD HD
HD HD
HD HD
HD HD
HD HD
HD HD
HD HD
HD
 HD
HD