videose
Главная
Displaying
thumbs
How to Plot a Graph of Linear Equations In Python
HD
youtube.com
22.02.2022
In this video, we will be learning and visualizing how to plot a graph of linear equations in python. We will be using a library called matplotlib to plot ou...
Похожие
видео
HD
26.12.2021
07:08
how to plot an exponential function in python | plotting exponential function in pycharm
youtube.com
HD
22.02.2022
07:28
How to Plot a Graph of Linear Equations In Python
youtube.com
15.01.2020
07:16
Matplotlib Tutorial | Example of how to create chart animation with matplotlib in...
youtube.com
02.12.2023
05:13
Graphing with matplotlib.pyplot to make a scatter plot with error bars
rutube.ru
HD
10.09.2022
16:53
Plotting Graphs in Python (MatPlotLib and PyPlot)
youtube.com
HD
27.09.2022
22:23
Use a Slider in a Python Data App - Dash Plotly
youtube.com
26.11.2023
30:06
Build a Complete Social Media Analysis Dashboard with Dash Plotly in Python - Part 2
rutube.ru
02.12.2023
01:05:33
Python Plotly Course: Learn Data Visualization in Python
rutube.ru
HD
17.11.2021
02:14
How to Graph the Equation y = 2x - 1
youtube.com
25.04.2010
03:14
How to Plot a Graph in Excel (Video Tutorial)
youtube.com
HD
21.06.2019
08:39
Acceleration down an inclined plane - graphing motion (NCPQ)
youtube
HD
14.02.2014
08:25
Visual Basic .NET Tutorial 36 - How to use Chart /Graph in VB.NET
youtube
HD
05.11.2017
09:48
Create Python GUI Application using PyQt5 Designer with Python 3.6.3
youtube
HD
30.01.2013
25:33
Algebra II Main Lesson VI.2: Graphing Linear Equations in two Variables
youtube
05.08.2022
05:41:36
4. Introduction to Deep Learning (Higher School of Economics)
vk.com
HD
19.08.2022
01:32:33
udemy-the-complete-pythonpostgresql-course-2.0-2022-1-1
vk.com
HD
02.07.2013
22:47
PyOP2: a Framework for Performance-Portable Unstructured Mesh-based Simulations, SciPy 2013
youtube
 HD
HD HD
HD

 HD
HD HD
HD

 HD
HD
 HD
HD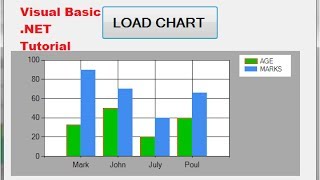 HD
HD HD
HD HD
HD
 HD
HD HD
HD