t Test in SPSS (Part 1) - Dependent Samples t (Paired Samples t) HD
How to run the dependent samples t test in SPSS (and interpret the results) is shown in this video (part 1 of 2). For our SPSS video series, click here: SPSS Descriptive Statistics Videos: http://tinyurl.com/m4srgoh SPSS Inferential Statistics Videos: http://tinyurl.com/lm9hpwc Quantitative Specialists (aka statistics instructor) YouTube Channel: https://www.youtube.com/user/statisticsinstructor Channel Description: For step by step help with statistics, with a focus on SPSS. Both descriptive and inferential statistics covered. For descriptive statistics, topics covered include: mean, median, and mode in spss, standard deviation and variance in spss, bar charts in spss, histograms in spss, bivariate scatterplots in spss, stem and leaf plots in spss, frequency distribution tables in spss, creating labels in spss, sorting variables in spss, inserting variables in spss, inserting rows in spss, and modifying default options in spss. For inferential statistics, topics covered include: t tests in spss, anova in spss, correlation in spss, regression in spss, chi square in spss, and MANOVA in spss. New videos regularly posted. Videos series coming soon include: multiple regression in spss, factor analysis in spss, nonparametric tests in spss, multiple comparisons in spss, linear contrasts in spss, and many more. Subscribe today! YouTube Channel: https://www.youtube.com/user/statisticsinstructor Lifetime access to SPSS videos: http://tinyurl.com/m2532td
 HD
HD HD
HD HD
HD HD
HD HD
HD HD
HD HD
HD HD
HD HD
HD HD
HD HD
HD
 HD
HD HD
HD HD
HD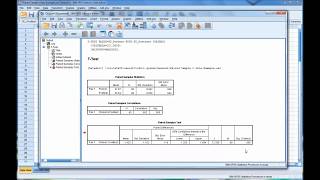 HD
HD HD
HD HD
HD
 HD
HD
 HD
HD HD
HD HD
HD HD
HD HD
HD![SAMPLING DISTRIBUTION IN HINDI PART 1 [STUDENT - T DISTRIBUTION IN HINDI] #for ip university](https://i.ytimg.com/vi/frdG3HDdGTY/mqdefault.jpg) HD
HD
 HD
HD HD
HD HD
HD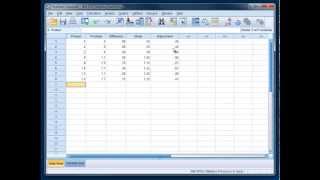 HD
HD