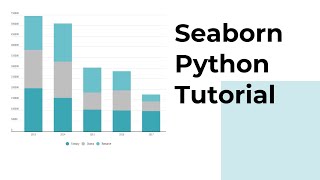
Seaborn Complete Data Visualization and Analysis | Real Data Set Example HD
Seaborn Tutorial, how to plot various plots offered by Seaborn Python. Explore various data sets in the seaborn, Python Data Visualization library. Work with the Penguin dataset in seaborn. Load image, load libraries, and plot various plots in seaborn. Countplots, histograms, box plots, violin plots, pair plots, correlation plots. Understand how to interpret the plots. For more information visit: https://machinemantra.in/2020/09/23/seaborn-tutorial/ GitHub Link: https://github.com/Prianca25/Machine-Learning/blob/master/Penguin%20Dataset.ipynb Machine Learning Podcast https://anchor.fm/priyanka-sharma12 Courses: Learn at your own pace enroll on Udemy: Get Data Analysis and Visualization Courses on Udemy at a very affordable price. Designed to help clear your doubts in a more organized and structured manner. Udemy https://www.udemy.com/course/data-analysis-visualization-with-python/?referralCode=834CBC3B42CEB204D5E3 I invite you to join me on Quora and Instagram https://www.quora.com/q/gnlqevqgyulcqgxe Instagram https://www.instagram.com/machinemantra/?hl=en #pythondatavisualization #dataanalysis #pythontutorial #pythonprojects #machinelearning #sourcecode #priyankasharma #machinemantra
Похожие видео
 HD
HD HD
HD HD
HD HD
HD HD
HD HD
HD HD
HD HD
HD HD
HD HD
HD HD
HD HD
HD HD
HD HD
HD HD
HD HD
HD HD
HD HD
HD

 HD
HD HD
HD

 HD
HD HD
HD HD
HD HD
HD HD
HD HD
HD HD
HD HD
HDПоказать еще