Python Curve Fit with Step Test Data HD
The Scipy curve_fit function determines two unknown coefficients (dead-time and time constant) to minimize the difference between predicted and measured response values. Pandas imports the data and the dataframe header is diplayed with x.head(). Conditional statements are used to create a step function and curve_fit from Scipy.optimize finds the optimal parameter values that minimize a sum of squared error. A Matplotlib plot shows the function with optimal parameter values. An R-squared value is 0.999, showing excellent agreement between the predictions and measurements. Course Material: https://apmonitor.com/che263/index.php/Main/PythonSolveEquations Github Repository (see HW04.ipynb): https://github.com/APMonitor/learn_python Schedule: https://apmonitor.com/che263/index.php/Main/CourseSchedule Solution Videos: https://apmonitor.com/che263/index.php/Main/CourseHomework
Похожие видео
 HD
HD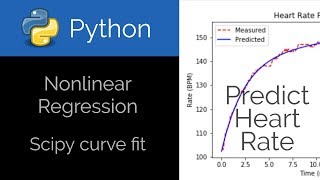 HD
HD HD
HD![Selenium Python : Work on Dropdown & List[Call/Wtsapp: +91-8743-913121-to Buy Full Course]](https://i.ytimg.com/vi/Iiat5mc1Yz8/mqdefault.jpg) HD
HD HD
HD HD
HD HD
HD![[GUIDE] Oneplus One Flashing 16GB and 64GB [Fastboot,Recovery] [Tested]](https://i.ytimg.com/vi/07WRxdC9cvQ/mqdefault.jpg) HD
HD HD
HD HD
HD HD
HD HD
HD HD
HD HD
HD HD
HD HD
HD HD
HD HD
HD HD
HD![Python Tutorial for Beginners - Learn Python in 5 Hours [FULL COURSE]](data:image/gif;base64,R0lGODlhAQABAIAAAAAAAP///yH5BAEAAAAALAAAAAABAAEAAAIBRAA7)
![Python Tutorial for Beginners - Learn Python in 5 Hours [FULL COURSE]](https://i.ytimg.com/vi/t8pPdKYpowI/mqdefault.jpg) HD
HD HD
HD HD
HD![Robot Framework: Step by Step Installation [Call/WhatsApp: +91-8743-913121 to Buy Full Course]](https://i.ytimg.com/vi/38HPxnrXMHo/mqdefault.jpg) HD
HD HD
HD HD
HD HD
HD HD
HD HD
HD HD
HD HD
HDПоказать еще