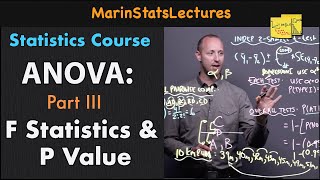
ANOVA: F Statistic and P Value | Statistics Tutorial #27 | MarinStatsLectures HD
ANOVA F Statistic (Test Statistic) and P Value: Concepts and Calculations ANOVA with R Tutorial: https://goo.gl/kY4kyE More Statistics and R Programming Tutorials: https://goo.gl/4vDQzT What does the F statistic tell you in Anova (One Way Analysis Of Variance)? How do you find the F statistic? How to interpret F value and p-value in ANOVA? What is the degree of freedom for F test? What does a large F statistic mean? Find answers to all these questions and more in this video! ▶︎▶︎A Brief Overview: ▶︎ the purpose of ANOVA: One Way Analysis of Variance (ANOVA) is used to compare the means of 3 or more independent groups. ▶︎ ANOVA test Assumptions: The ANOVA test requires assuming independent observations, independent groups, that the variance (or standard deviation) of the two groups being compared are approximately equal or that the sample size for each group is large ▶︎ What is F Statistic and How do you find the F Statistic? The analysis of variance test involves comparing variability explained by group differences (between group variability) to variability that can not be explained by group differenced (within group variability). This is done by calculating an F statistic that it the ratio of the two. Large values for the test statistic indicate there is likely a difference in means for at least one group. ▶︎▶︎ Watch More ▶︎ Analysis Of Variance ANOVA in R, Multiple Comparisons in R, Kurskal Wallis in R https://goo.gl/kY4kyE ▶︎ANOVA: Use and Assumptions https://youtu.be/_VFLX7xJuqk ▶︎ ANOVA: Understanding Sum of Squares https://youtu.be/-AeU4y2vkIs ▶︎ ANOVA: Bonferroni Multiple Comparisons Correction https://youtu.be/pscJPuCwUG0 ▶︎ Two Sample t test for independent groups https://youtu.be/mBiVCrW2vSU ▶︎ Paired t test https://youtu.be/Q0V7WpzICI8 ■ Table of Content: 0:0:23 What is the sum of squares in Anova ? 0:0:42 Building up test statistic for ANOVA with an example 0:0:51 Getting familiar with the notations used in test statistic formula 0:1:44 Building the formula for the explained and unexplained sum of squares with an example 0:3:43 Pooled variance for two sample t test assuming equal variance and within group variance, are they the same? 0:5:42 How do you find the F statistic? F Statistic or Test Statistic Formula and Explanation 0:5:08 Hypothesis test and F Statistic 0:7:16 F Distribution explained 0:7:53 How to interpret F value and p-value in ANOVA 0:8:42 What does the F statistic tell you in Anova? ▶︎ The video that follows introduces conducting post-hoc multiple comparisons. Follow MarinStatsLectures Subscribe: https://goo.gl/4vDQzT website: https://statslectures.com Facebook:https://goo.gl/qYQavS Twitter:https://goo.gl/393AQG Instagram: https://goo.gl/fdPiDn Our Team: Content Creator: Mike Marin (B.Sc., MSc.) Senior Instructor at UBC. Producer: Ladan Hamadani (B.Sc., BA., MPH) These videos are created by #marinstatslectures to support a course at The University of British Columbia (UBC) (#SPPH400: #Intr
Похожие видео
 HD
HD HD
HD HD
HD
 HD
HD HD
HD


 HD
HD HD
HD
 HD
HD HD
HD HD
HD HD
HD HD
HD HD
HD HD
HD
 HD
HD HD
HD HD
HD HD
HD HD
HD

 HD
HD HD
HD HD
HD HD
HDПоказать еще