Tutorial 18 - Cross-section and 3D visualization of borehole and geology data. HD
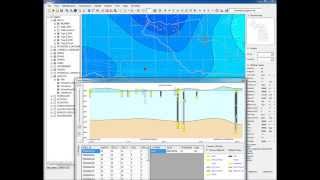
This video illustrates the use of the Michigan Groundwater Management Tool (MGMT) to visualize hydro-geologic and lithologic data in cross-sectional profiles and using 3-dimensional views. Cross-sections are drawn through multiple wells, which are then plotted in profile depicting the detailed lithology information from each well. Similarly, a 3-dimensional rendering of well logs, bedrock geology and other aspects of the modeling framework-such as DEM, bedrock elevations, streams and lakes, and road networks-are illustrated .These powerful tools can be used to visualize complex information and can provide valuable insights into hydro-geologic processes. The steps to create the model are outlined briefly: (1) Click on “Select polygon features” and double-click on Ottawa County, Michigan. (2) A “Model Options” window will appear; use the default options and click “Apply”. This will create a flow field for the whole of Ottawa County. (3) Now expand and check the “WELLS” group and check the “All_Wells” layer. This displays all of the existing wells in this area. (4) Zoom in to the middle portion of the county and click on “Track Polyline for Cross-section” and draw a polyline passing through wells in the map. To start drawing single-click on each vertex of the polyline. To finish the polyline, double-click at the last vertex. (5) A cross-section view comes up showing the land surface, the interpolated water table surface from the interpolated flow field, bedrock top and the individual well logs. The well logs show different colors corresponding to the various lithologic materials present such as “Sand”, “Clay”, “Sandstone” etc. Information about each well, such as the surface elevation, thickness of each lithologic material, the depth to bedrock top, and the water table, is displayed below. (6) Notice that a red arrow indicating the location of the cursor moves in the plan-view map as the cursor is moved along the cross-section. (7) Click on the “More” button on the left-hand side of the cross-section to show the display options. Check “marshall” and “coldwater” and click OK. This will display the Marshall sandstone formation elevations and the coldwater shale formation elevations. (8) Scroll through the list of wells to display detailed information about each well. Close the cross-section window. (9) Click on “Select 3D model area” and draw a polygon around the area that needs to be visualized in 3D. (10) The “3D Model Options” window will appear with default information on number of rows and columns and the grid size of the 3d model. Go to the “Layer information” tab and select the following layers “WELLS”, Streams (order 3 and greater), All Roads, Lakes (class 4 and greater), and click OK. (11) The 3D model opens up, Uncheck ”DEM_WATER_TABLE” and “WATER_TABLE_BEDROCK”. Under “GWFLOW”, uncheck “WATER_TABLE”. Use the “Screen Navigation” icon to rotate and view the 3D model from different angles. (12) Increase the vertical exaggeration factor
 HD
HD HD
HD HD
HD HD
HD![Comparison of chest X-ray and Sherlock 3CG™ TCS – Video Abstract [121230]](https://i.ytimg.com/vi/FrGLuFP_dOA/mqdefault.jpg) HD
HD HD
HD HD
HD HD
HD HD
HD HD
HD HD
HD HD
HD HD
HD HD
HD HD
HD HD
HD
 HD
HD HD
HD HD
HD
 HD
HD HD
HD HD
HD HD
HD HD
HD
 HD
HD HD
HD HD
HD HD
HD HD
HD