Calculating Critical Values for T Distribution in Excel and Building Chart HD
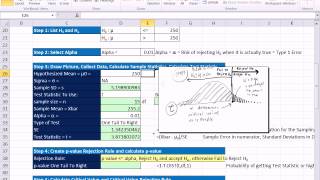
This video demonstrates how to calculate critical values for the t distribution in Excel and construct a critical value chart. These critical values are compared with the t statistic from Independent-Samples or Paired-Samples (Dependent-Samples) T Tests to determine if there is statistical significance.
 HD
HD HD
HD HD
HD HD
HD
 HD
HD
 HD
HD HD
HD

 HD
HD HD
HD HD
HD HD
HD HD
HD HD
HD HD
HD HD
HD
 HD
HD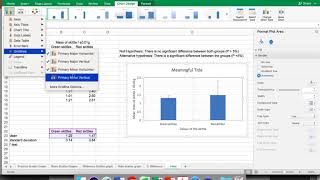 HD
HD HD
HD HD
HD HD
HD HD
HD HD
HD HD
HD HD
HD HD
HD HD
HD